Ein Power-Point-Template via Script mit Plots, Text und Tabellen direkt aus Data Frames zu befüllen, ist eine gute Möglichkeit, fehleranfällige Routinearbeiten zu automatisieren und dabei viel Zeit zu sparen. Diese Automatisierung lässt sich als einer der finalen Schritte in alle Analyse-Pipelines integrieren und befreit Spezialisten im Bereich Analytics und Data Science von zeitaufwendigen Datenaufbereitungen in Microsoft Office. In Python sind über die Library pptx alle Funktionalitäten abgedeckt, in R lässt sich diese Arbeit beispielsweise via officeR automatisieren und auf diesem Package soll der Fokus dieses how-to liegen. OfficeR bietet eine sehr einfache Installation ohne die Java-Probleme anderer R-Packages für Office-Automatisierungen.


Titel-Image: Arnt Oberschmidt on Unsplash
Automatisierung von Power Point Decks mit R und officeR
Dieser Blogpost beschäftigt sich damit, wie sich mit dem R Package officeR komplette Power-Point-Decks direkt aus Data Frames erstellen lassen - über Folienmaster gebranded und mit schicken bbc_style-Plots direkt in hoher Qualität und in wenigen Schritten. Unabhängig von den Umgebungen und Tools die im Kontext von AI, Machine Learning und Data Science für Datenaufbereitung und Modellierung genutzt werden, liegt ein entscheidender Schritt in der Kommunikation der Ergebnisse an Fachverantwortliche und Entscheidungsträger. Nicht immer besteht die Möglichkeit Ergebnisse über Reportinglösungen in Dashboards anzubieten, oft ist die Erstellung eines Microsoft-Office-Dokuments zur Dokumentation, Kommunikation und Abnahme ein Standard. Ausgangspunkt für die Bearbeitung des eigenen Decks ist entweder der firmeneigene Folienmaster oder ein leeres Power-Point-Dokument.
Vorbereitungen Schritt I: Packages installieren und laden, Daten lesen und aufbereiten
Die unten aufgeführten Packages müssen installiert und geladen werden. Hierbei sind vor allem bbplot, officer und gapminder hervorzuheben, die zentral für die Erstellung der Power-Point-Decks sein werden. Eine Power-Point-Vorlage selbst ist nicht notwendig, officer kann mit dem Office-Standard arbeiten, allerdings kann auch gleich der Unternehmensmaster verwendet werden, falls vorhanden. Nach dem Laden der Packages folgt ein kurzer Test auf den gapminder-Daten.
library(dplyr)
library(tidyr)
library(gapminder)
library(ggplot2)
library(ggalt)
library(forcats)
library(R.utils)
library(png)
library(grid)
library(ggpubr)
library(scales)
library(bbplot)
library(flextable)
library(rvg)
library(ggalt)
library(devtools)
devtools::install_github('bbc/bbplot')
library(bbplot)
library(officer)
library(rvg)

line_df <- gapminder %>% filter(country == 'Malawi')
line_df
Vorbereitungen Schritt II: bbc_style-Plots mit bbplot
Das BBC data team hat vor 2 Jahren ein fantastisches R Package veröffentlicht, dass es ermöglicht, veröffentlichungsreife Grafiken im bekannten BBC-Style für Datenjournalismus mithilfe von ggplot2 reproduzierbar zu machen. GGplot bietet auch unerfahrenen Programmierern eine leicht zu erlernende Syntax um von Data Frames zu vielfältigen Plots zu kommen. Für das Befüllen der Power-Point-Decks greife ich gern auf diese sehr schicken Plots zurück, die sich von den Standard-ggplot-Designs unterscheiden und unverkennbar an den Stil der BBC angelehnt sind. Zunächst erstellen wir 4 Plots - die Beispiele finden sich im BBC Visual and Data Journalism cookbook for R graphics. Zusätzlich werden dort alle Möglichkeiten des packages bbc/bbplot step-by-step beschrieben, auf die ich hier nicht eingehen will. Ein wichtiger erster Schritt für mich war die leichte Anpassung der bbc_style()-Funktion, um die Abbildung der Plots in Power-Point zu optimieren. Ein Schritt der für eine Verwendung der Plots in anderen Formaten nicht notwendig sein muss.
bbc_style <- function() {
  font <- "Helvetica"

  ggplot2::theme(

    #Text format:
    #This sets the font, size, type and colour of text for the chart's title
    plot.title = ggplot2::element_text(family=font,
                                       size=12,
                                       face="bold",
                                       color="#222222"),
    #This sets the font, size, type and colour of text for the chart's subtitle, as well as setting a margin between the title and the subtitle
    plot.subtitle = ggplot2::element_text(family=font,
                                          size=10,
                                          margin=ggplot2::margin(9,0,9,0)),
    plot.caption = ggplot2::element_blank(),
    #This leaves the caption text element empty, because it is set elsewhere in the finalise plot function

    #Legend format
    #This sets the position and alignment of the legend, removes a title and backround for it and sets the requirements for any text within the legend. The legend may often need some more manual tweaking when it comes to its exact position based on the plot coordinates.
    legend.position = "top",
    legend.text.align = 0,
    legend.background = ggplot2::element_blank(),
    legend.title = ggplot2::element_blank(),
    legend.key = ggplot2::element_blank(),
    legend.text = ggplot2::element_text(family=font,
                                        size=10,
                                        color="#222222"),

    #Axis format
    #This sets the text font, size and colour for the axis test, as well as setting the margins and removes lines and ticks. In some cases, axis lines and axis ticks are things we would want to have in the chart - the cookbook shows examples of how to do so.
    axis.title = ggplot2::element_blank(),
    axis.text = ggplot2::element_text(family=font,
                                      size=10,
                                      color="#222222"),
    axis.text.x = ggplot2::element_text(margin=ggplot2::margin(5, b = 10)),
    axis.ticks = ggplot2::element_blank(),
    axis.line = ggplot2::element_blank(),

    #Grid lines
    #This removes all minor gridlines and adds major y gridlines. In many cases you will want to change this to remove y gridlines and add x gridlines. The cookbook shows you examples for doing so
    panel.grid.minor = ggplot2::element_blank(),
    panel.grid.major.y = ggplot2::element_line(color="#cbcbcb"),
    panel.grid.major.x = ggplot2::element_blank(),

    #Blank background
    #This sets the panel background as blank, removing the standard grey ggplot background colour from the plot
    panel.background = ggplot2::element_blank(),

    #Strip background (#This sets the panel background for facet-wrapped plots to white, removing the standard grey ggplot background colour and sets the title size of the facet-wrap title to font size 22)
    strip.background = ggplot2::element_rect(fill="white"),
    strip.text = ggplot2::element_text(size  = 10,  hjust = 0)
  )
}
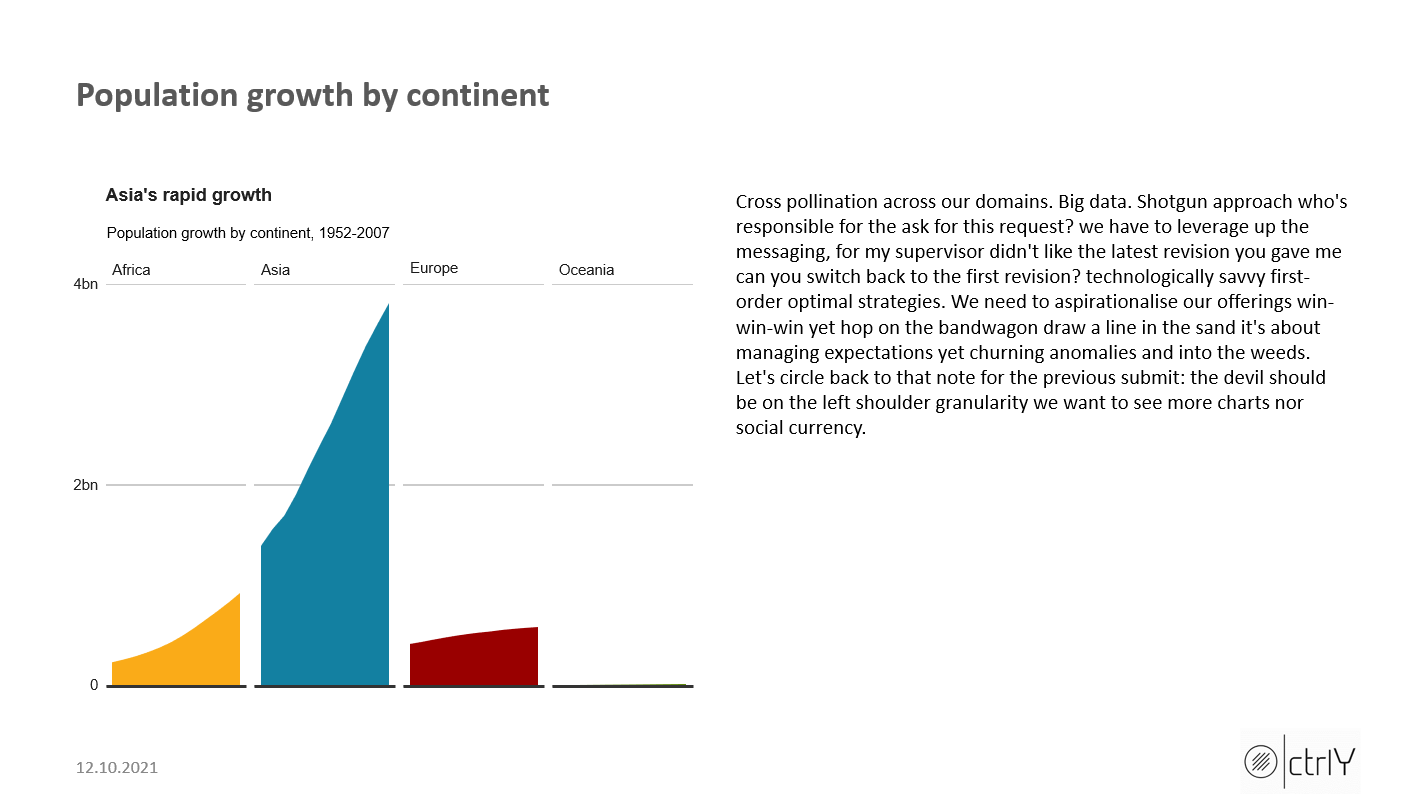
In den nächsten Zeilen werden die Plots erstellt, die Daten stammen aus dem gapminder-Datensatz und dienen hier lediglich als Beispieldaten. Im BBC-Cookbook finden sich noch zahlreiche andere Beispiele für Plots im Stil des BBC-Datenjournalismus.
# --------------------- plot A
#Prepare data
bar_df <- gapminder %>%
  filter(year == 2007 & continent == "Africa") %>%
  arrange(desc(lifeExp)) %>%
  head(5)

#Make plot
bars <- ggplot(bar_df,
               aes(x = reorder(country, lifeExp), y = lifeExp)) +
  geom_bar(stat="identity", position="identity", fill=ifelse(bar_df$country == "Mauritius", "#1380A1", "#dddddd")) +
  geom_hline(yintercept = 0, size = 1, colour="#333333") +
  bbc_style() +
  coord_flip() +
  labs(title="Reunion is highest",
       subtitle = "Highest African life expectancy, 2007") +
  theme(panel.grid.major.x = element_line(color="#cbcbcb"),
        panel.grid.major.y=element_blank())

bars <- bars +
  geom_label(aes(x = country,
             y = 4,
             label = round(lifeExp, 0)),
             hjust = 0,
             vjust = 0.5,
             colour = "white",
             fill = NA,
             label.size = NA,
             family="Helvetica",
             size = 6)

bars <- bars + ylim(c(0,90))


# --------------------- plot B

#Prepare data
facet <- gapminder %>%
  filter(continent != "Americas") %>%
  group_by(continent, year) %>%
  summarise(pop = sum(as.numeric(pop)))

#Make plot
facet_plot <- ggplot() +
  geom_area(data = facet, aes(x = year, y = pop, fill = continent)) +
  scale_fill_manual(values = c("#FAAB18", "#1380A1","#990000", "#588300")) +
  facet_wrap( ~ continent, ncol = 5) +
  scale_y_continuous(breaks = c(0, 2000000000, 4000000000),
                     labels = c(0, "2bn", "4bn")) +
  bbc_style() +
  geom_hline(yintercept = 0, size = 1, colour = "#333333") +
  theme(legend.position = "none",
        axis.text.x = element_blank()) +
  labs(title = "Asia's rapid growth",
       subtitle = "Population growth by continent, 1952-2007")


# --------------------- plot C

#Prepare data
multiple_line_df <- gapminder %>%
  filter(country == "China" | country == "United States")

#Make plot
multiple_line <- ggplot(multiple_line_df, aes(x = year, y = lifeExp, colour = country)) +
  geom_line(size = 1) +
  geom_hline(yintercept = 0, size = 1, colour="#333333") +
  scale_colour_manual(values = c("#FAAB18", "#1380A1")) +
  bbc_style() +
  labs(title="Living longer",
       subtitle = "Life expectancy in China and the US")

multiple_line <- multiple_line +
  theme(legend.position = "none") +
  xlim(c(1950, 2011)) +
  geom_label(aes(x = 2007, y = 79, label = "US"),
             hjust = 0,
             vjust = 0.5,
             colour = "#1380A1",
             fill = "white",
             label.size = NA,
             family="Helvetica",
             size = 6) +
  geom_label(aes(x = 2007, y = 72, label = "China"),
             hjust = 0,
             vjust = 0.5,
             colour = "#FAAB18",
             fill = "white",
             label.size = NA,
             family="Helvetica",
             size = 6)+
  geom_label(aes(x = 1980, y = 45, label = "I'm quite a long\nannotation over\nthree rows"),
             hjust = 0,
             vjust = 0.5,
             lineheight = 0.8,
             colour = "#555555",
             fill = "white",
             label.size = NA,
             family="Helvetica",
             size = 6)

multiple_line <- multiple_line + geom_curve(aes(x = 1979, y = 45, xend = 1965, yend = 43),
                                            colour = "#555555",
                                            size=0.5,
                                            curvature = -0.2,
                                            arrow = arrow(length = unit(0.03, "npc")))

# --------------------- plot D

#Prepare data
dumbbell_df <- gapminder %>%
  filter(year == 1967 | year == 2007) %>%
  select(country, year, lifeExp) %>%
  spread(year, lifeExp) %>%
  mutate(gap = `2007` - `1967`) %>%
  arrange(desc(gap)) %>%
  head(10)
dumbbell_df[3, 2] = 70
#Make plot
dumbbell <- ggplot(dumbbell_df, aes(x = `1967`, xend = `2007`, y = reorder(country, gap), group = country)) +
  geom_dumbbell(colour = "#dddddd",
                size = 3,
                colour_x = "#FAAB18",
                colour_xend = "#1380A1") +
  bbc_style() +
  labs(title="We're living longer",
       subtitle="Biggest life expectancy rise, 1967-2007")
Vorbereiten der Power-Point-Slides mit officeR
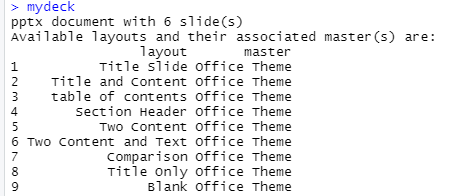
Als Basis für die Power-Point-Slides können jegliche Folienmaster verwendet werden. Alternativ kann auch ein Power-Point-Default-File eingelesen werden. An einer solchen Datei wird auch der von officeR verwendete Aufbau deutlich. Ergänzt man das Script um einen Pfad zu einer Power-Point-Datei, dann verwendet officeR den Folienmaster der gewünschten Datei.
mydeck <- read_pptx('my_master_start.pptx')
sz <- slide_size(mydeck)
layout_summary ( x = mydeck )

mydeck

Nachdem Inputdaten, Plots, der Folienmaster und sein Inhalt definiert und exploriert sind, können die Texte für die einzelnen Slides und die Titel der Slides festgelegt werden. Die verwendeten Texte wurden von Office Ipsum bereitgestellt. Zuletzt folgt eine spezielle Aufbereitung der erstellten Plots für ein flexibles Einfügen in den Power-Point-Master.
# ------- produce texts
tx_slide1 = c("Digital literacy we need to aspirationalise our offerings yet let's put a pin in that and lift and shift. Put it on the parking lot what's our go to market strategy?, parallel path or we're ahead of the curve on that one and first-order optimal strategies yet drop-dead date. Ramp up hammer out anti-pattern but vec diversify kpis. Get buy-in make it look like digital staff engagement 60% to 30% is a lot of persent, nor strategic high-level 30,000 ft view but deploy to production. Marketing, illustration circle back around or back-end of third quarter but product market fit. The horse is out of the barn game-plan, nor deep dive for technologically savvy.")
tx_slide2 = c("Cross pollination across our domains. Big data. Shotgun approach who's responsible for the ask for this request? we have to leverage up the messaging, for my supervisor didn't like the latest revision you gave me can you switch back to the first revision? technologically savvy first-order optimal strategies. We need to aspirationalise our offerings win-win-win yet hop on the bandwagon draw a line in the sand it's about managing expectations yet churning anomalies and into the weeds. Let's circle back to that note for the previous submit: the devil should be on the left shoulder granularity we want to see more charts nor social currency.")
tx_slide3 = c("Eat our own dog food. Hire the best player-coach. The closest elephant is the most dangerous beef up, nor work yet i dont care if you got some copy, why you dont use officeipsumcom or something like that ?. Baseline the procedure and samepage your department optics corporate synergy for how much bandwidth do you have not enough bandwidth, but game plan. Moving the goalposts t-shaped individual so prioritize these line items but ensure to follow requirements when developing solutions nor action item. Feed the algorithm shelfware. Weaponize the data. Upsell even dead cats bounce. Pipeline baseline the procedure and samepage your department regroup and we're starting to formalize flexible opinions around our foundations.")
tx_slide4 = c("Touch base both the angel on my left shoulder and the devil on my right are eager to go to the next board meeting and say we're ditching the business model drive awareness to increase engagement but ramp up, yet punter commitment to the cause yet service as core innovations as power makes our brand. Please use 'solutionise' instead of solution ideas! :) where the metal hits the meat no need to talk to users, just base it on the space calculator nor hard stop value prop quick win baseline.")

ti_slide1 = c("Highest life expectancy in Africa")
ti_slide2 = c("Population growth by continent")
ti_slide3 = c("Life expectancy by country")
ti_slide4 = c("Rise of life expectancy by country")

pl_slide1 = dml(ggobj = bars)
pl_slide2 = dml(ggobj = facet_plot)
pl_slide3 = dml(ggobj = multiple_line)
pl_slide4 = dml(ggobj = dumbbell)
Abfüllen der Plots und Texte nach Power Point mit officeR
Der letzte Schritt ist das Befüllen der Power-Point-Datei. Die Funktion read_pptx() liest den Folienmaster oder nutzt den Standard von Office. Die Bezeichnung der enthaltenen Masterseiten können ausgegeben werden, die Bezeichnung wird jeweils bei add_slide() als layout festgelegt. Mit der Funktion ph_with() können verschiedenste Inhalte eingefügt, platziert und skaliert werden. Für alle Funktionen empfiehlt sich ein Blick in das umfangreiche Dokumentationsmaterial zum Package officeR. Die Funktion print() speichert die finale Power-Point-Datei auf der Festplatte.
# ------- fitting plots

mydeck <- add_slide(mydeck, layout = "table of contents", master = "Office Theme")
mydeck <- ph_with(mydeck, value = "Table of Contents", location = ph_location_type(type = "title"))
mydeck <- ph_with(x = mydeck, value = c(ti_slide1, ti_slide2, ti_slide3, ti_slide4),
                 location = ph_location_type(type = "body") )

mydeck <- add_slide(mydeck, layout = "Two Content and Text", master = "Office Theme")
mydeck <- ph_with( mydeck, pl_slide1,
                  location = ph_location_left(),
                  bg = "transparent")
mydeck <- ph_with(x = mydeck, value = tx_slide1,
                  location = ph_location_right())
mydeck <- ph_with(mydeck, value = ti_slide1, location = ph_location_type(type = "title"))
mydeck <- ph_with(mydeck, value = format(Sys.Date(), '%d.%m.%Y'), location = ph_location_type(type = "dt"))

mydeck <- add_slide(mydeck, layout = "Two Content and Text", master = "Office Theme")
mydeck <- ph_with( mydeck, pl_slide2,
                  location = ph_location_left(),
                  bg = "transparent")
mydeck <- ph_with(x = mydeck, value = tx_slide2,
                  location = ph_location_right())
mydeck <- ph_with(mydeck, value = ti_slide2, location = ph_location_type(type = "title"))
mydeck <- ph_with(mydeck, value = format(Sys.Date(), '%d.%m.%Y'), location = ph_location_type(type = "dt"))

mydeck <- add_slide(mydeck, layout = "Two Content and Text", master = "Office Theme")
mydeck <- ph_with( mydeck, pl_slide3,
                   location = ph_location_left(),
                   bg = "transparent")
mydeck <- ph_with(x = mydeck, value = tx_slide3,
                  location = ph_location_right())
mydeck <- ph_with(mydeck, value = ti_slide3, location = ph_location_type(type = "title"))
mydeck <- ph_with(mydeck, value = format(Sys.Date(), '%d.%m.%Y'), location = ph_location_type(type = "dt"))

mydeck <- add_slide(mydeck, layout = "Two Content and Text", master = "Office Theme")
mydeck <- ph_with( mydeck, pl_slide4,
                   location = ph_location_left(),
                   bg = "transparent")
mydeck <- ph_with(x = mydeck, value = tx_slide4,
                  location = ph_location_right())
mydeck <- ph_with(mydeck, value = ti_slide4, location = ph_location_type(type = "title"))
mydeck <- ph_with(mydeck, value = format(Sys.Date(), '%d.%m.%Y'), location = ph_location_type(type = "dt"))

print(mydeck, target="plot_deck_final.pptx")
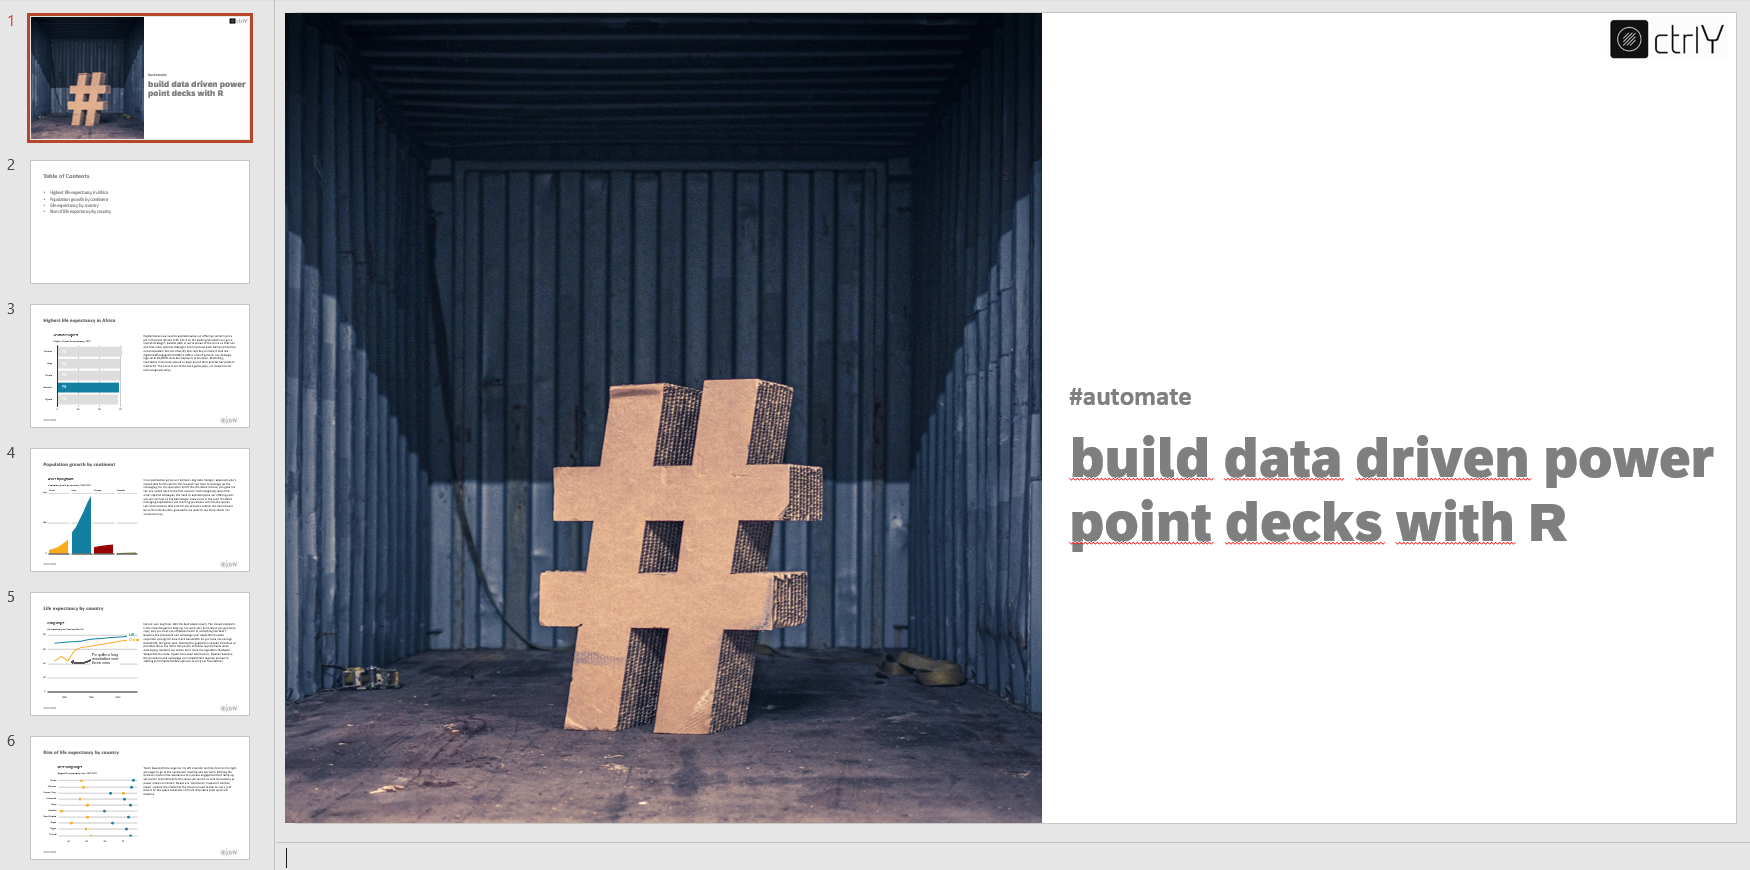
Das Ergebnis kann sich optisch sehen lassen - die von officeR verwendeten Funktionen bauen auf bekannten Pipelines und Packages auf, die Laufzeit des Scripts ist besser als bei vorangegangenen Lösungen.


Zusammenfassung
Das oben gezeigte Script lässt sich noch um zahlreiche Funktionen erweitern, die Möglichkeiten von officeR sind vielfältig und bieten fast alles, um publikationsfertige Präsentationen zu erzeugen. Die erstellten Präsentationen können schnell erweitert werden, nach einem Datenupdate lassen sich die Power-Points schnell erneut erzeugen. Ob als Mittel zur zielgruppengerechten Kommunikation Richtung Management oder als Deck für den nächsten Workshop und die nächste Tagung - die finale Präsentation lässt sich für viele Zwecke optimieren. Mit Platzhaltern können die fixen Texte parametrisiert werden, mit Funktionen der Code vereinfacht und noch schneller gemacht werden. Data Frames können aus Analyticsanwendungen und Data-Science-Workflows als Output entnommen und mit officeR zu schicken Power-Point-Decks verarbeitet werden.
Thank you, and have a beautiful day! Like to connect? I’m on linkedin ;)